Generate Test Suite
Scenarios
AREX record real online traffic as a huge number of test cases, users can filter out some important cases from them, and save them as classic cases for reuse, as well as use them for regular regression validation.
Cases can be saved in both the Recording Case List and the Replay Case List. The only difference between the two types of solidified cases is the interface address:
- Cases saved from the Recording Case List have not yet been tested by replay, so the interface addresses requested by these cases point to the recording environment.
- Cases saved from the Replay Case List have interface addresses that correspond to the replay environment.
- Once cases are saved, they do not expire and remain valid indefinitely.
Save recorded cases
After recording the requests to the application, click on the application name to view the list of test cases.
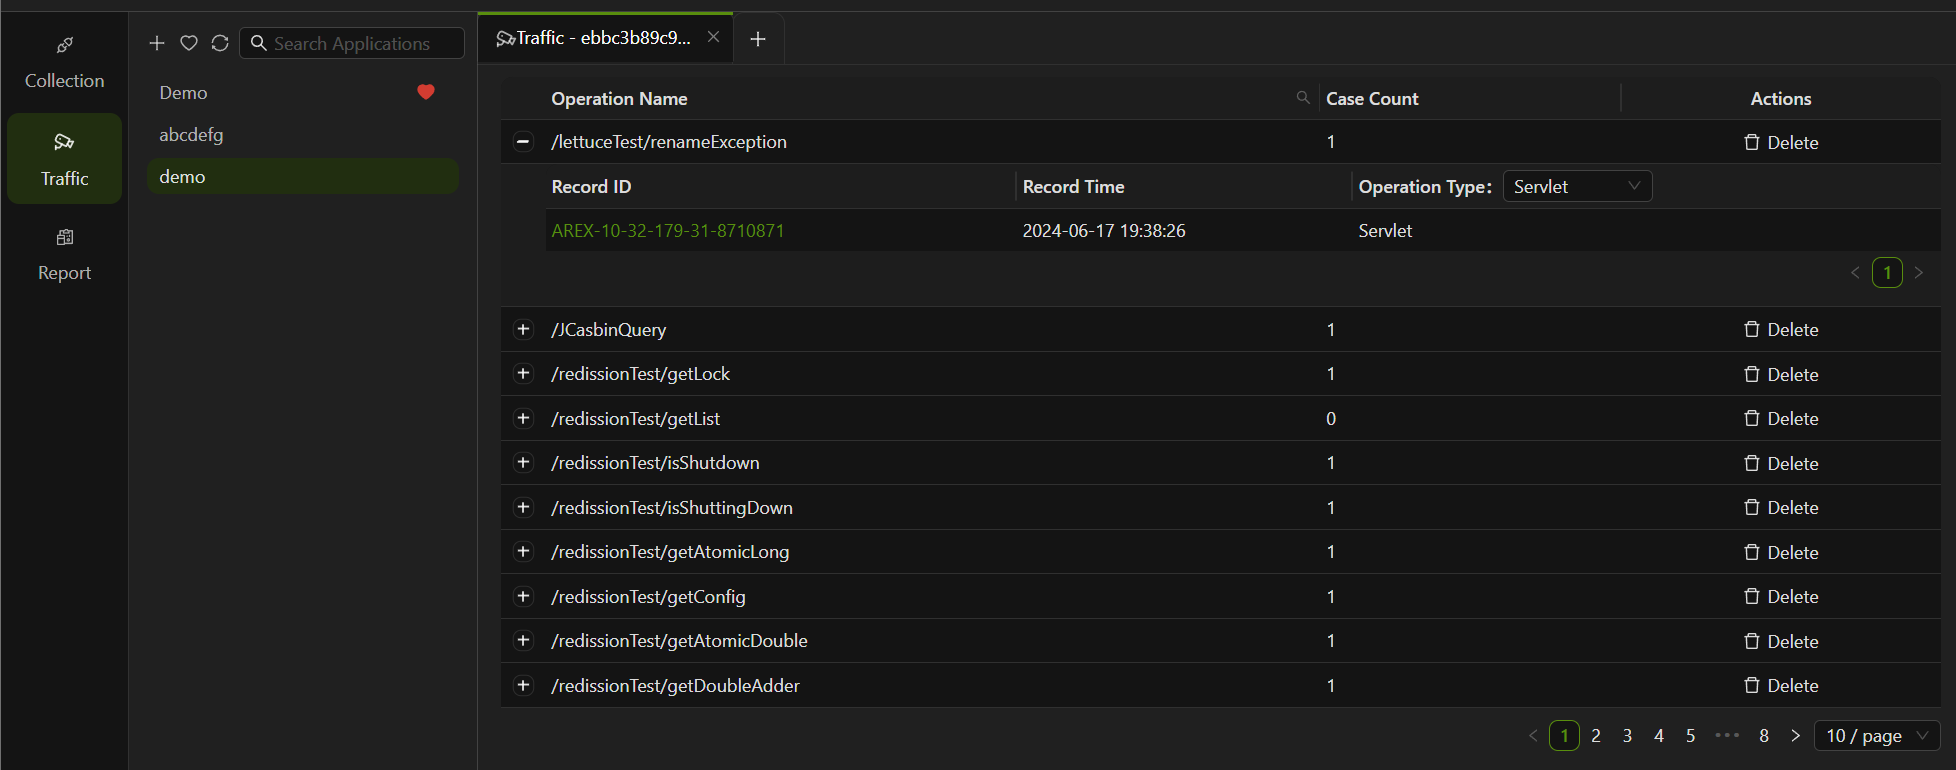
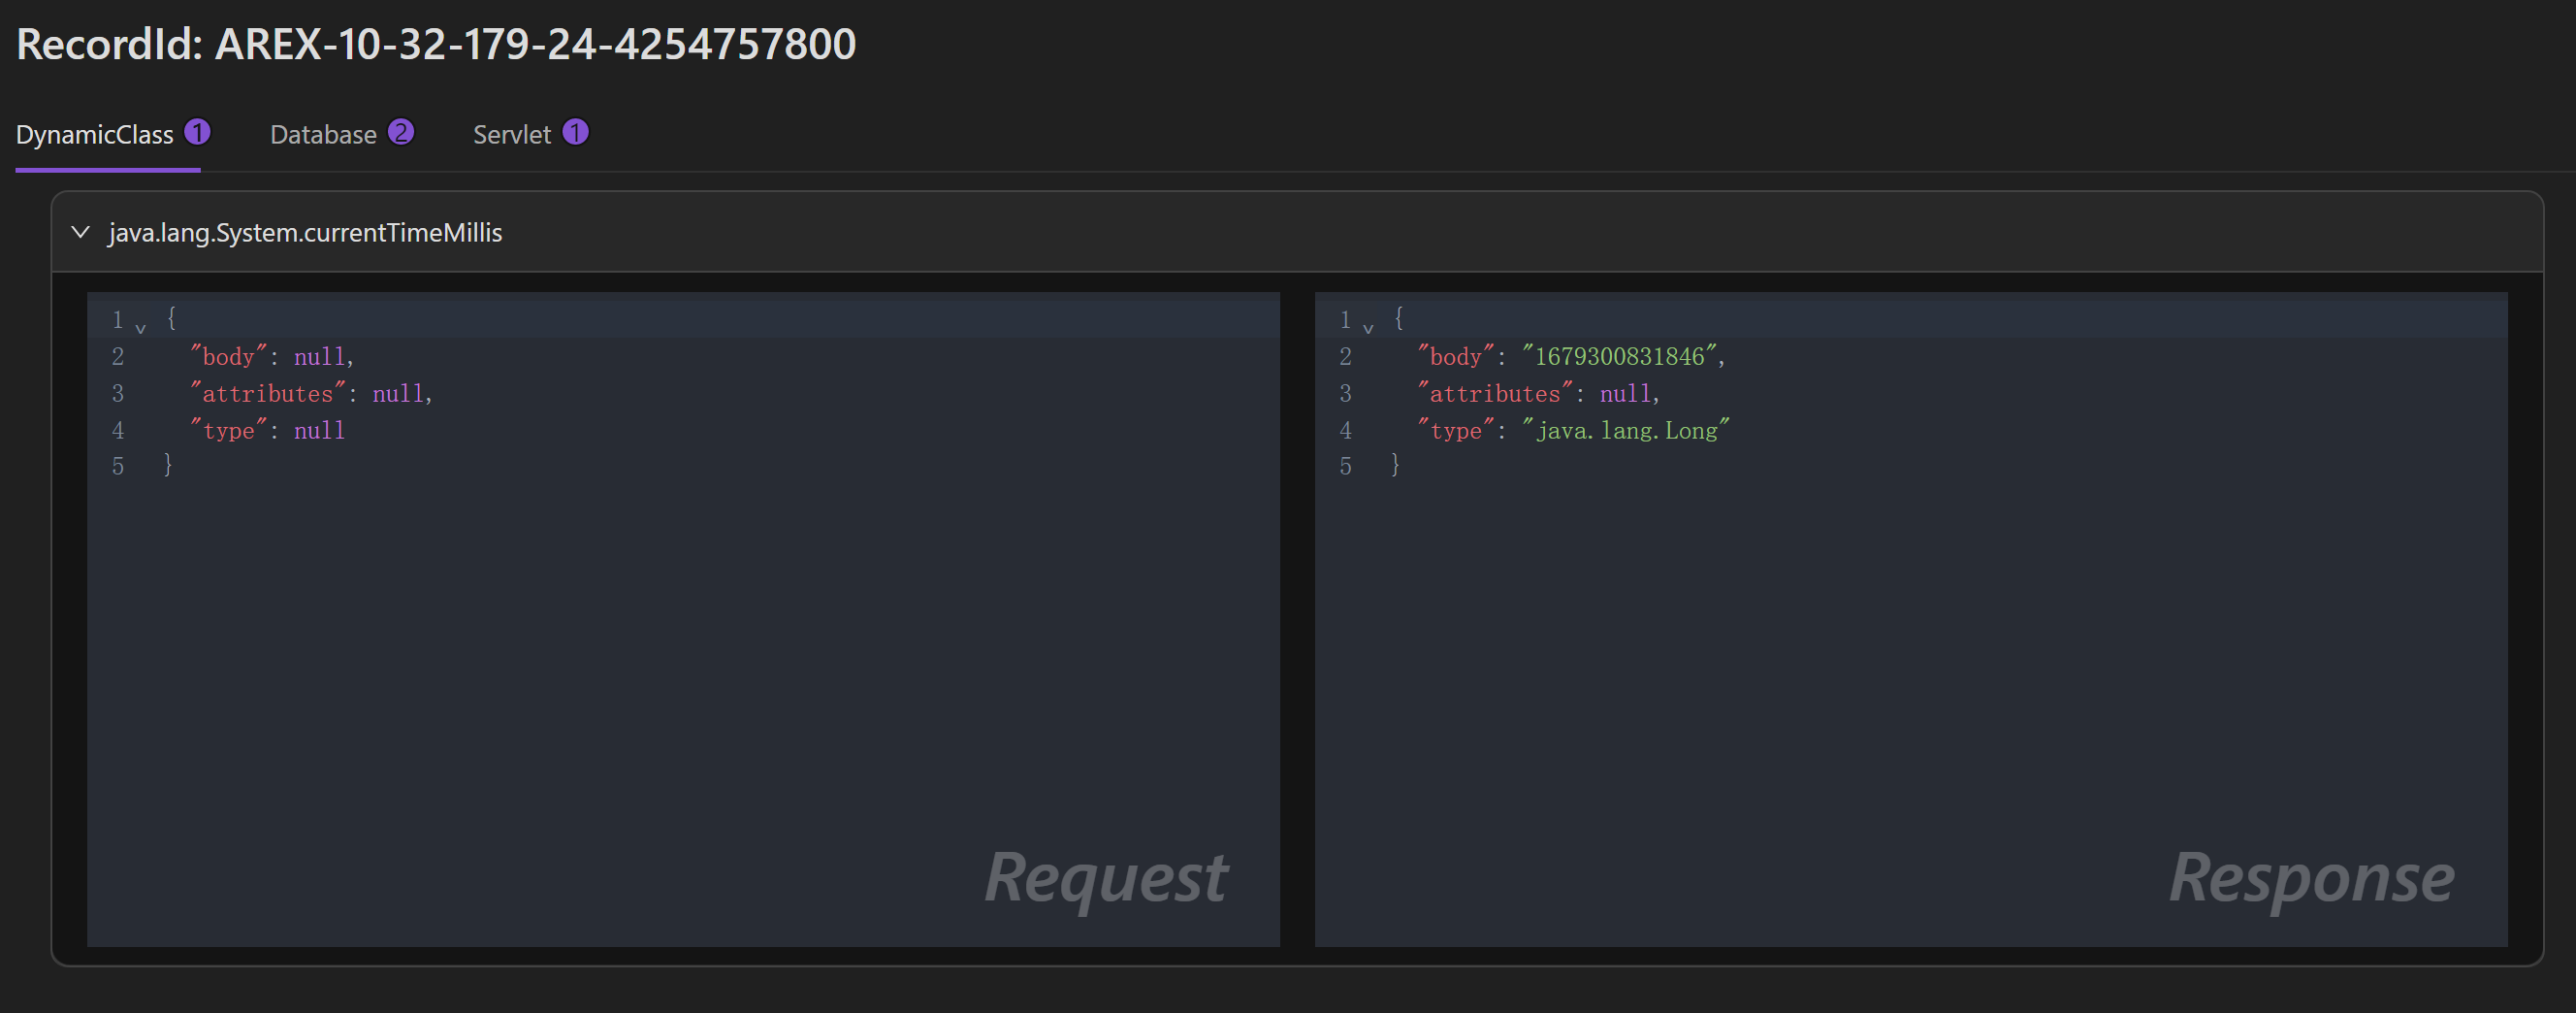
Locate the test case that requires saving and click on the Record ID to view the recording details.
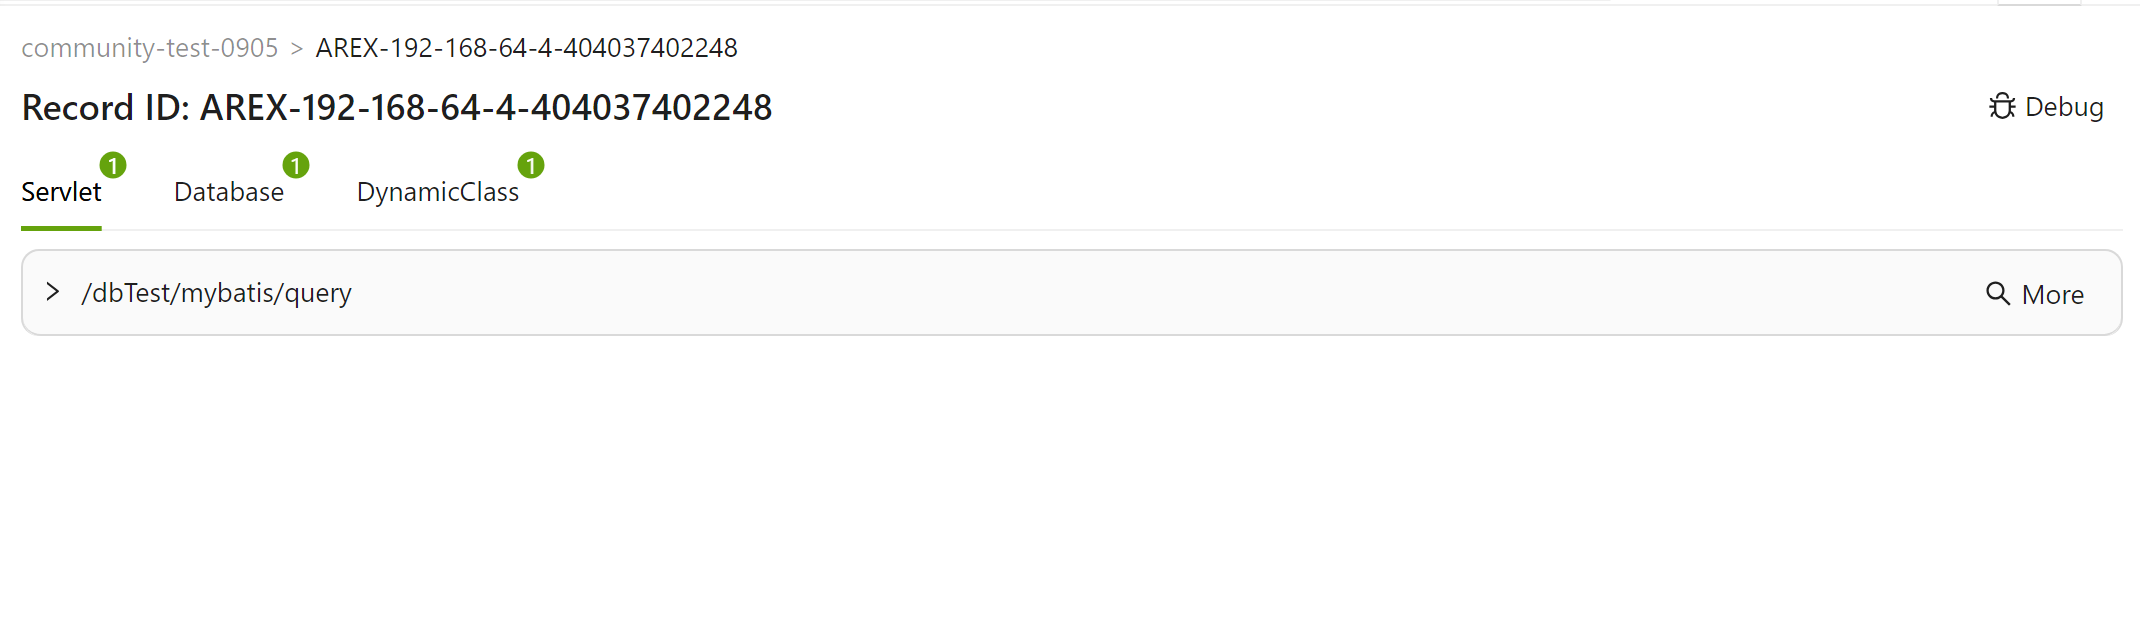
Click the Debug button in the upper right corner to enter the debugging page.
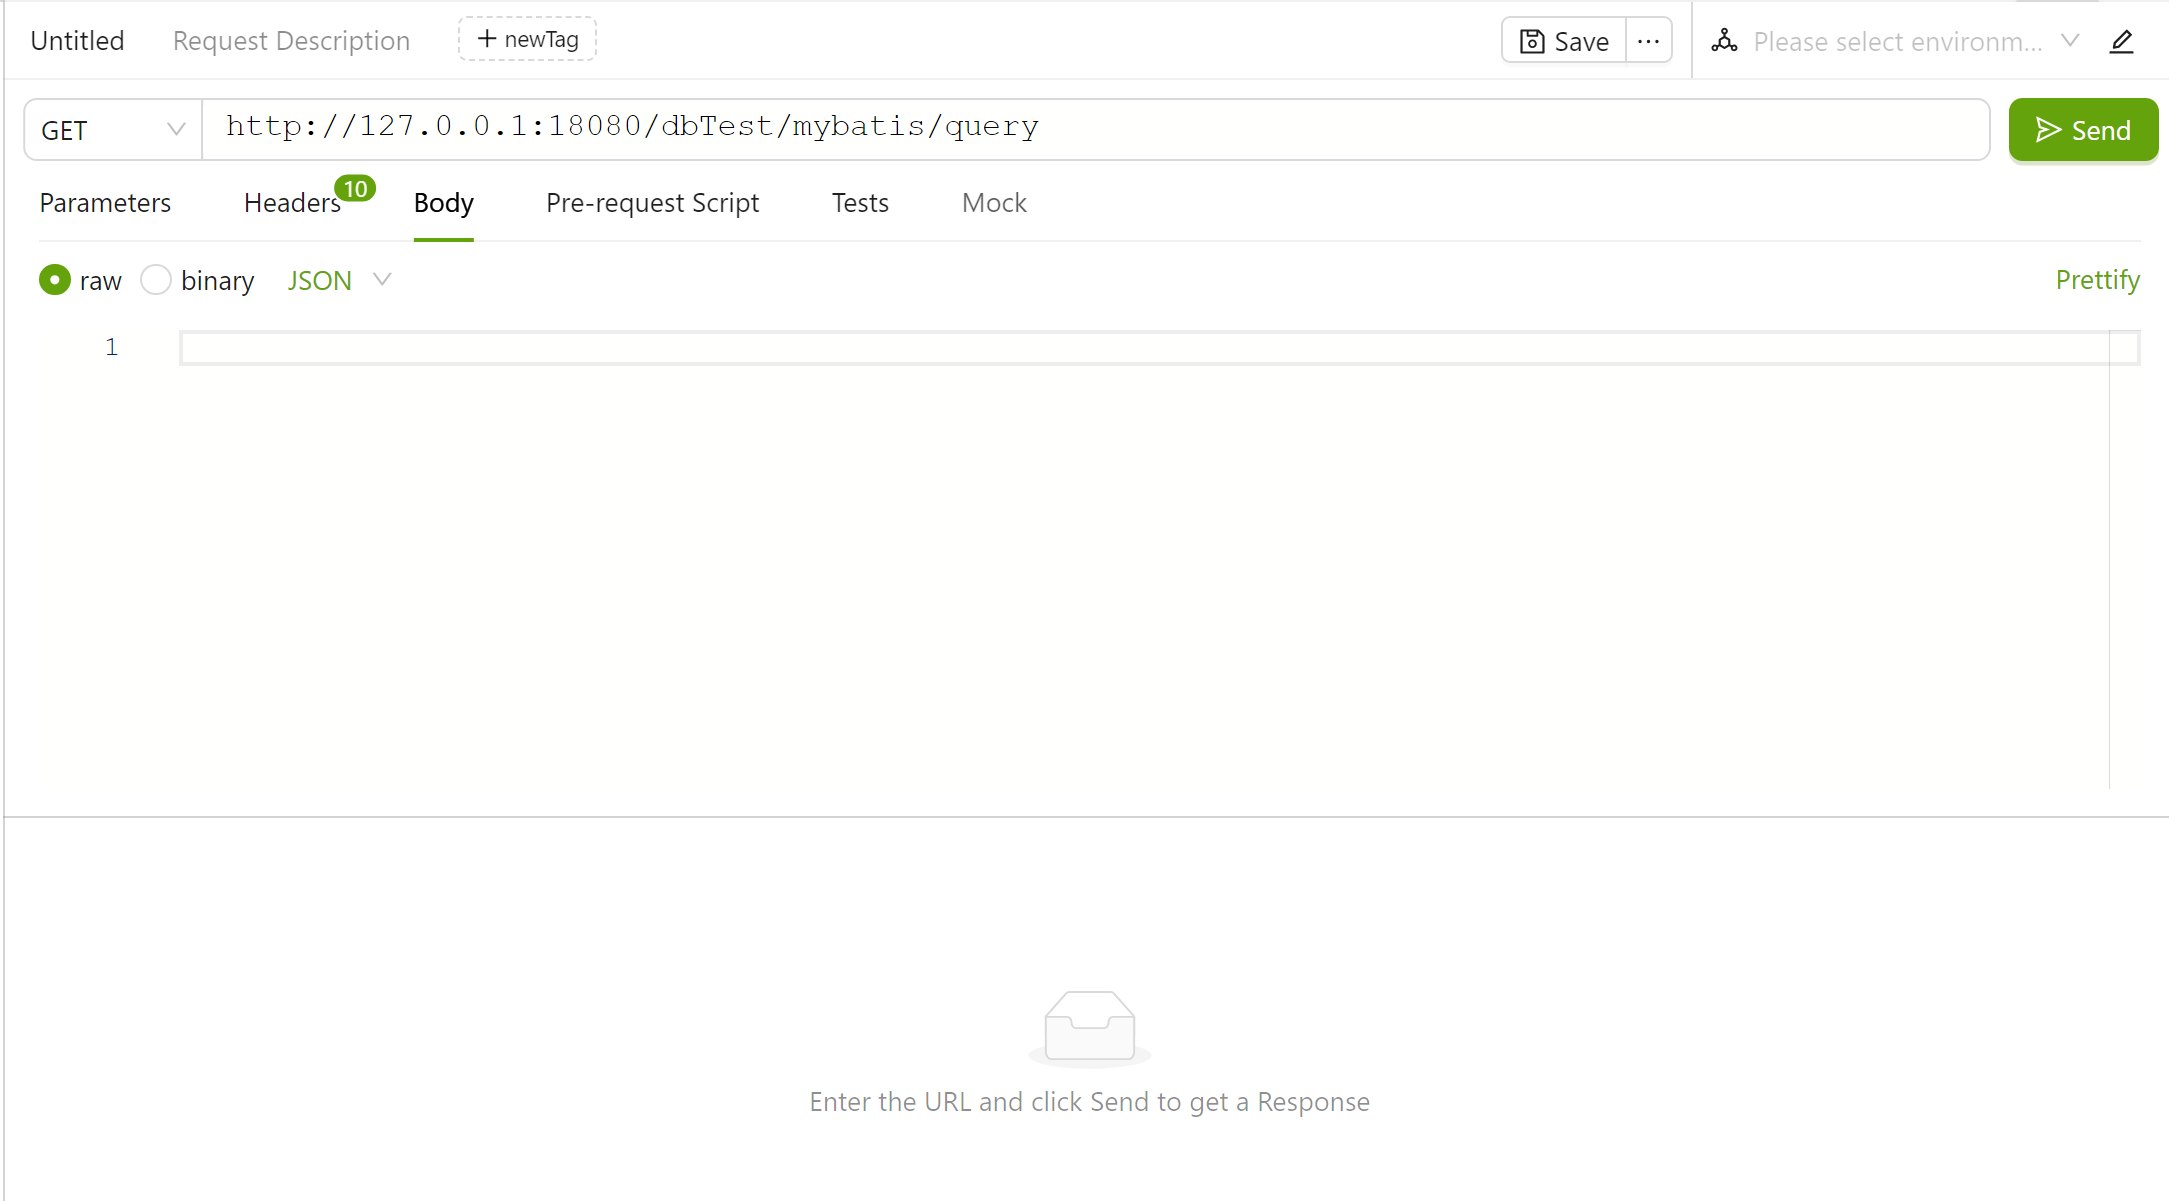
Click the save button in the upper right corner to save the recording case. You can choose the path generated by default by AREX or customize the save path.
Save replayed cases
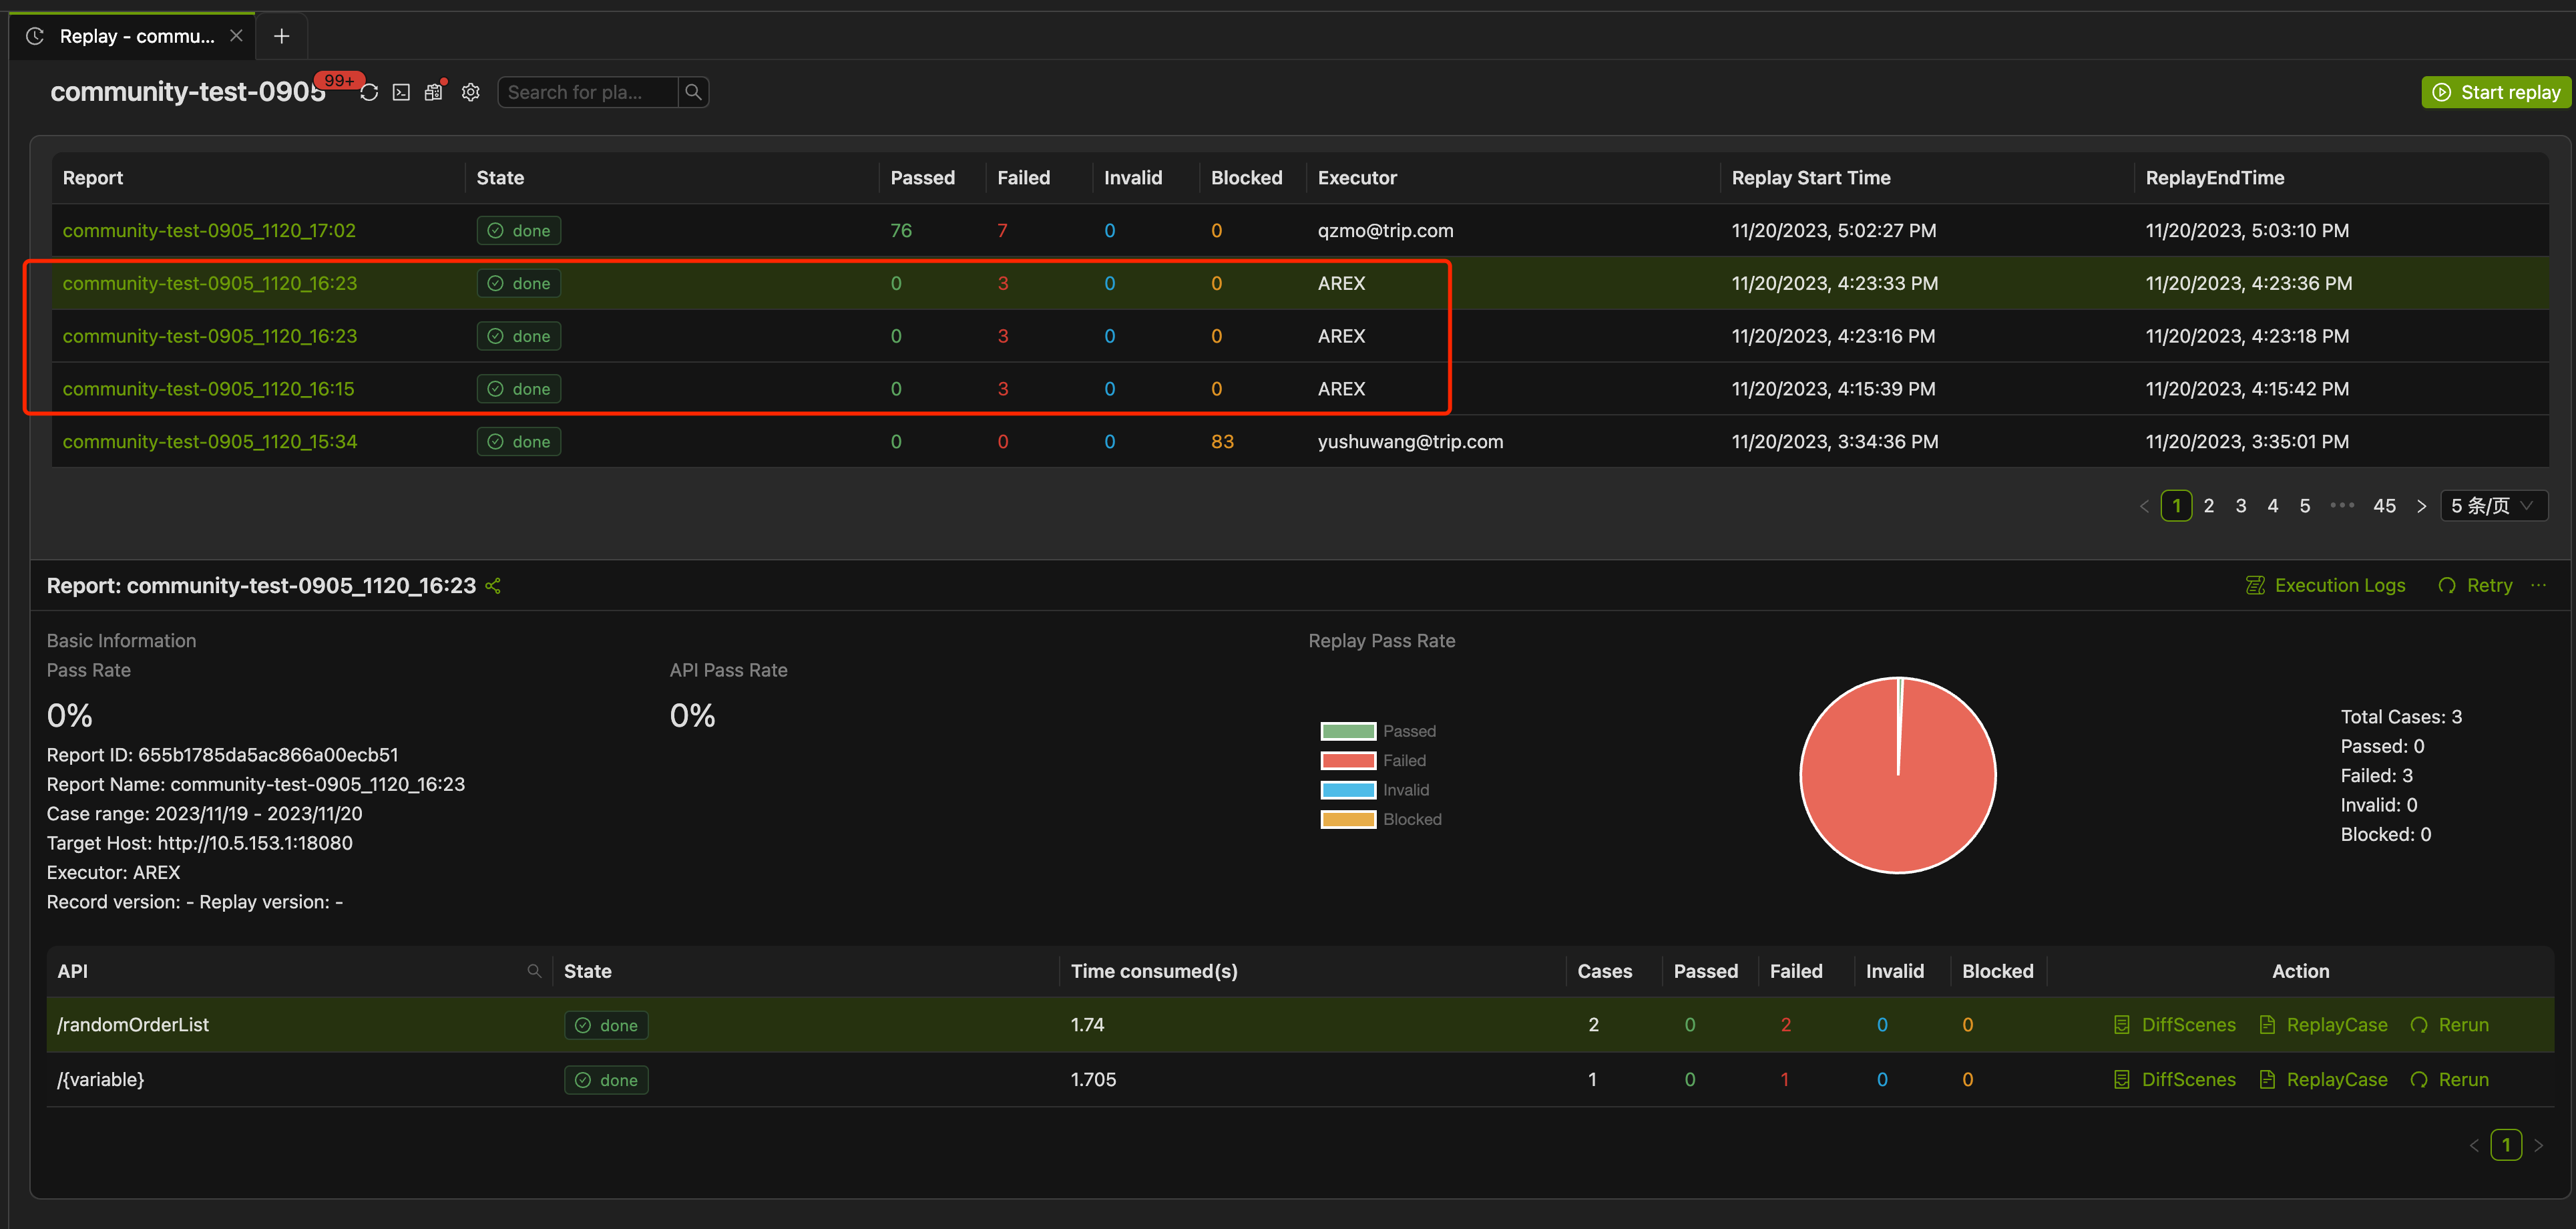
After completing a replay test, proceed to the replay report page.
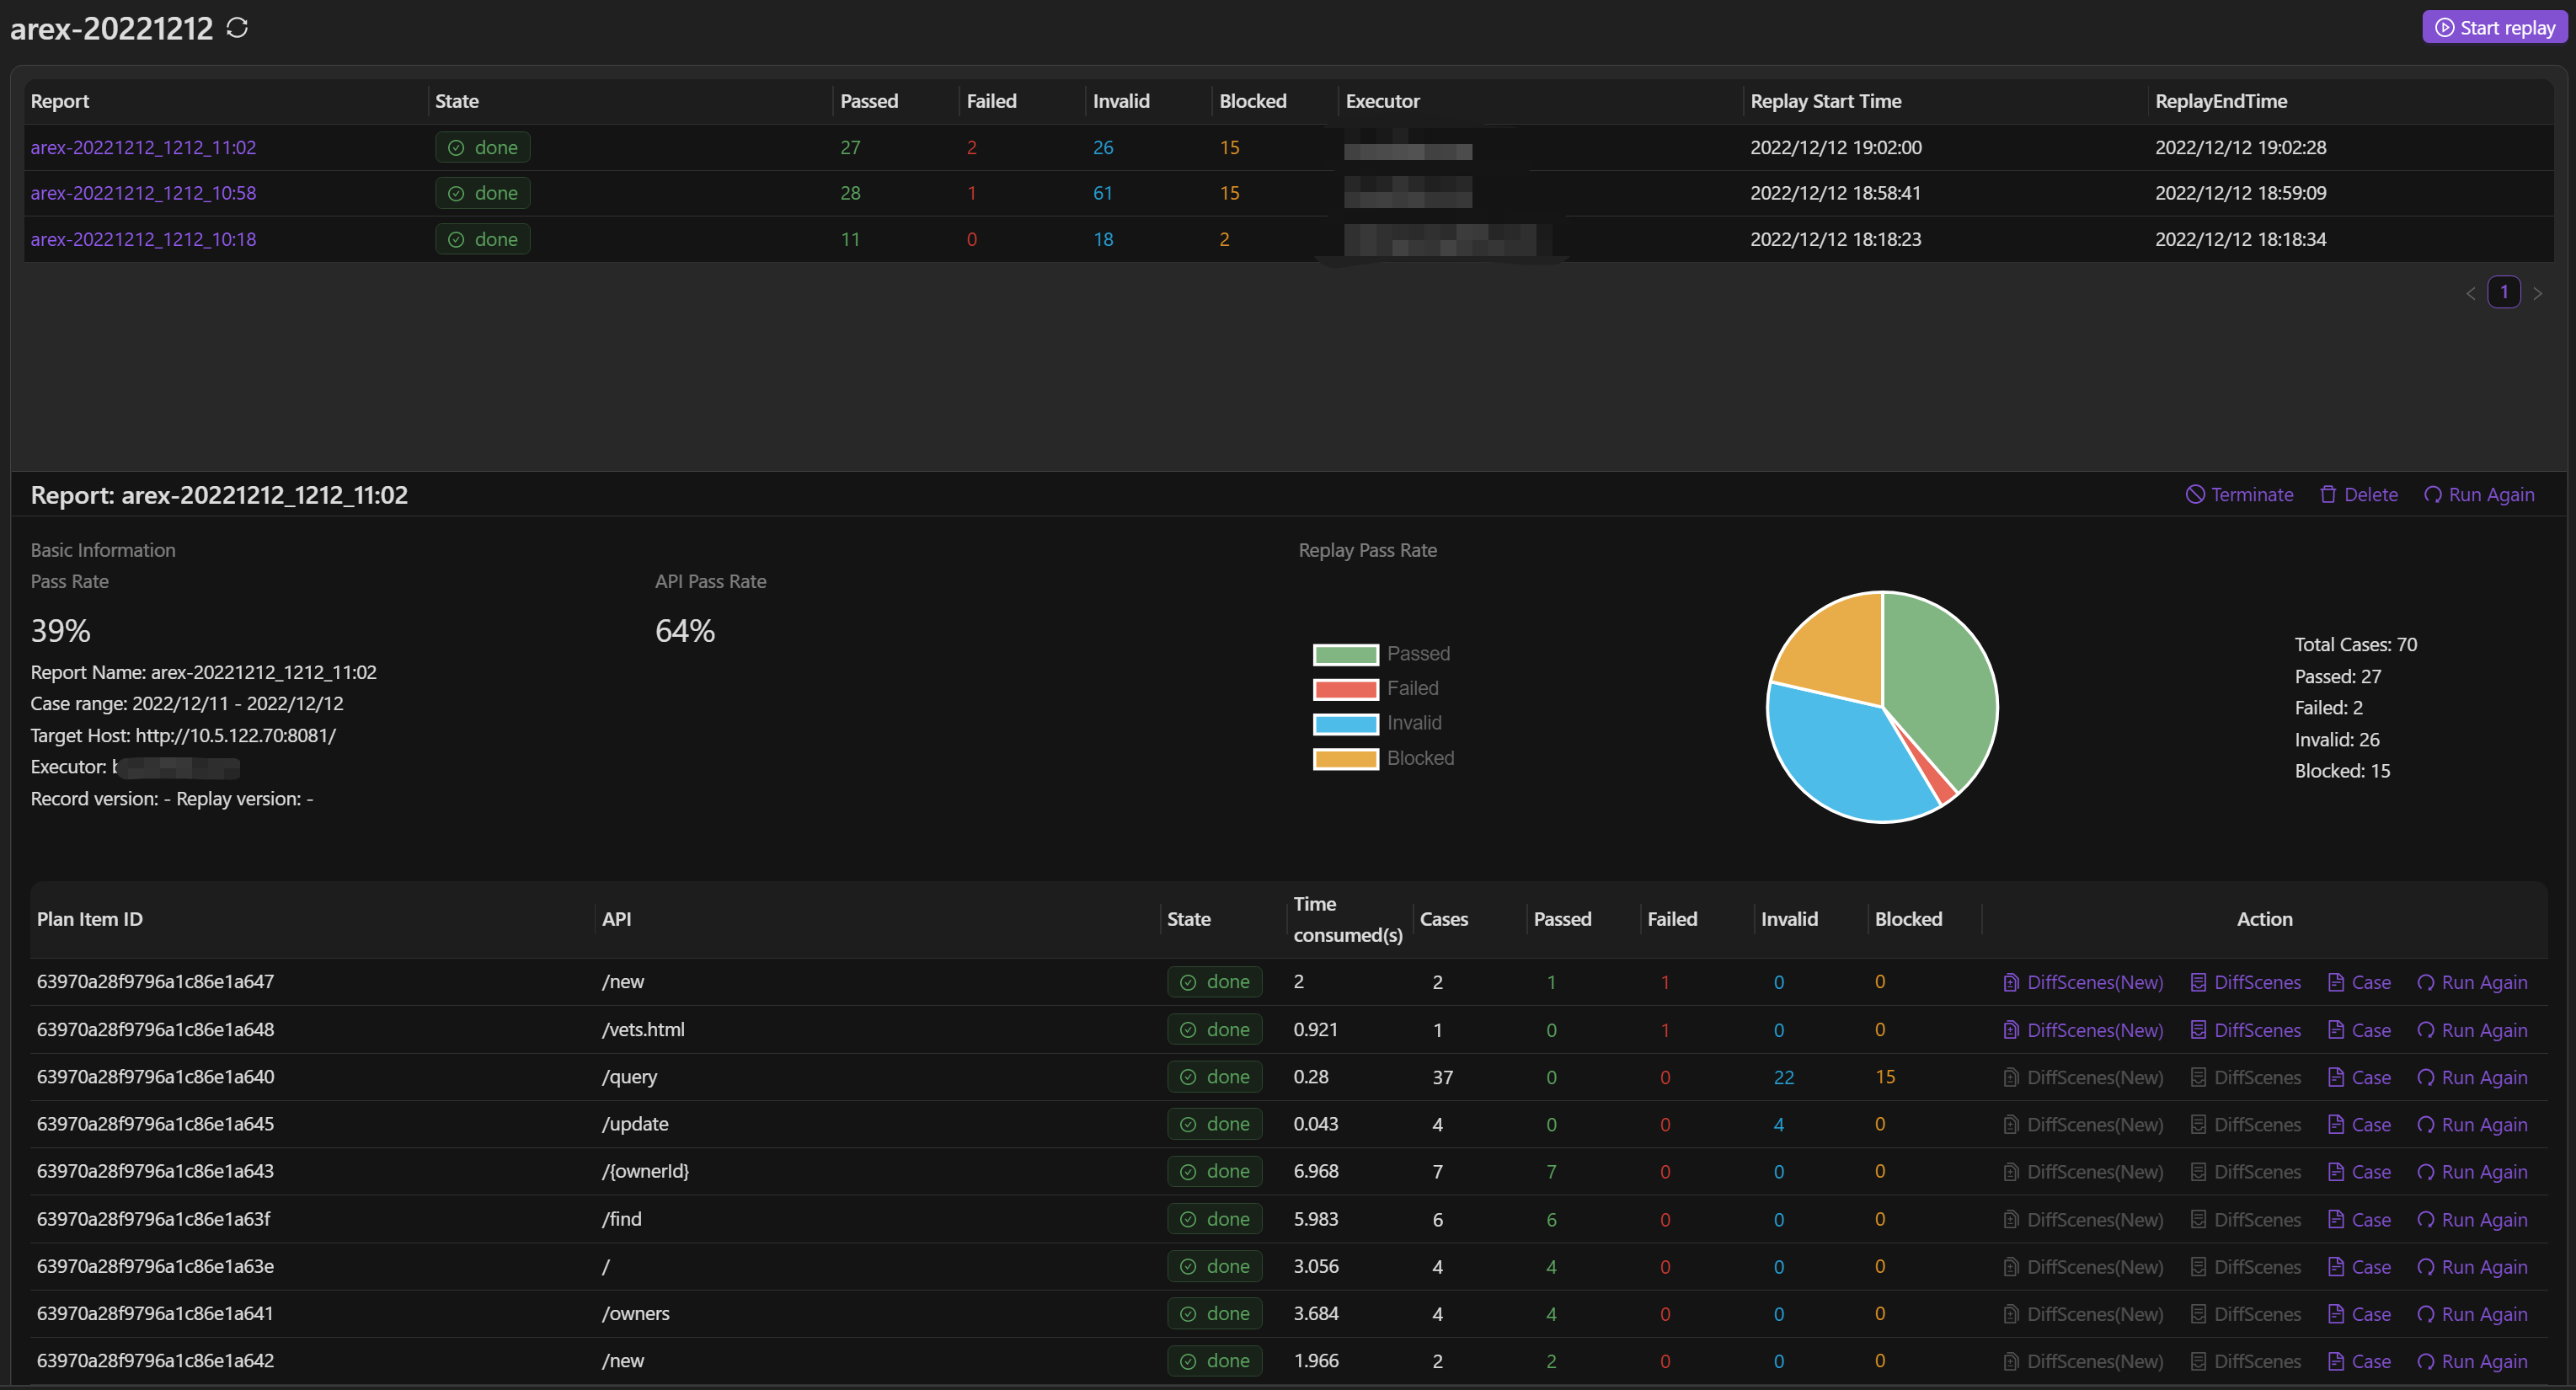
Click on ReplayCase to review the recorded test cases.
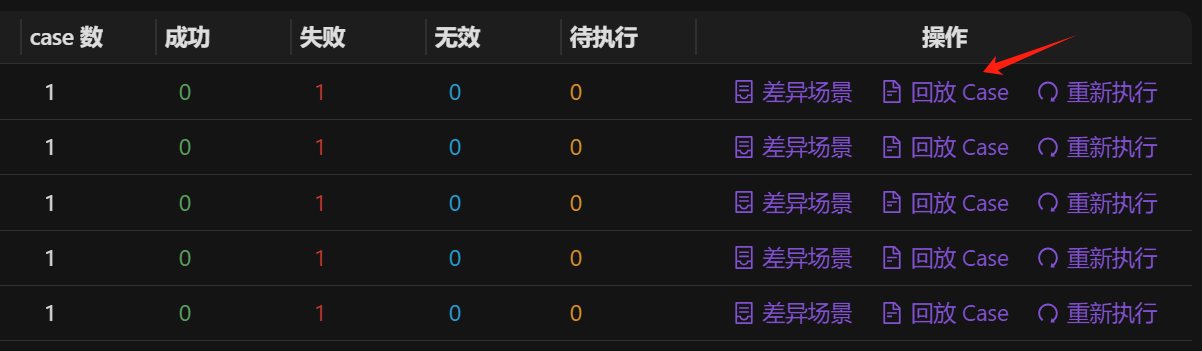
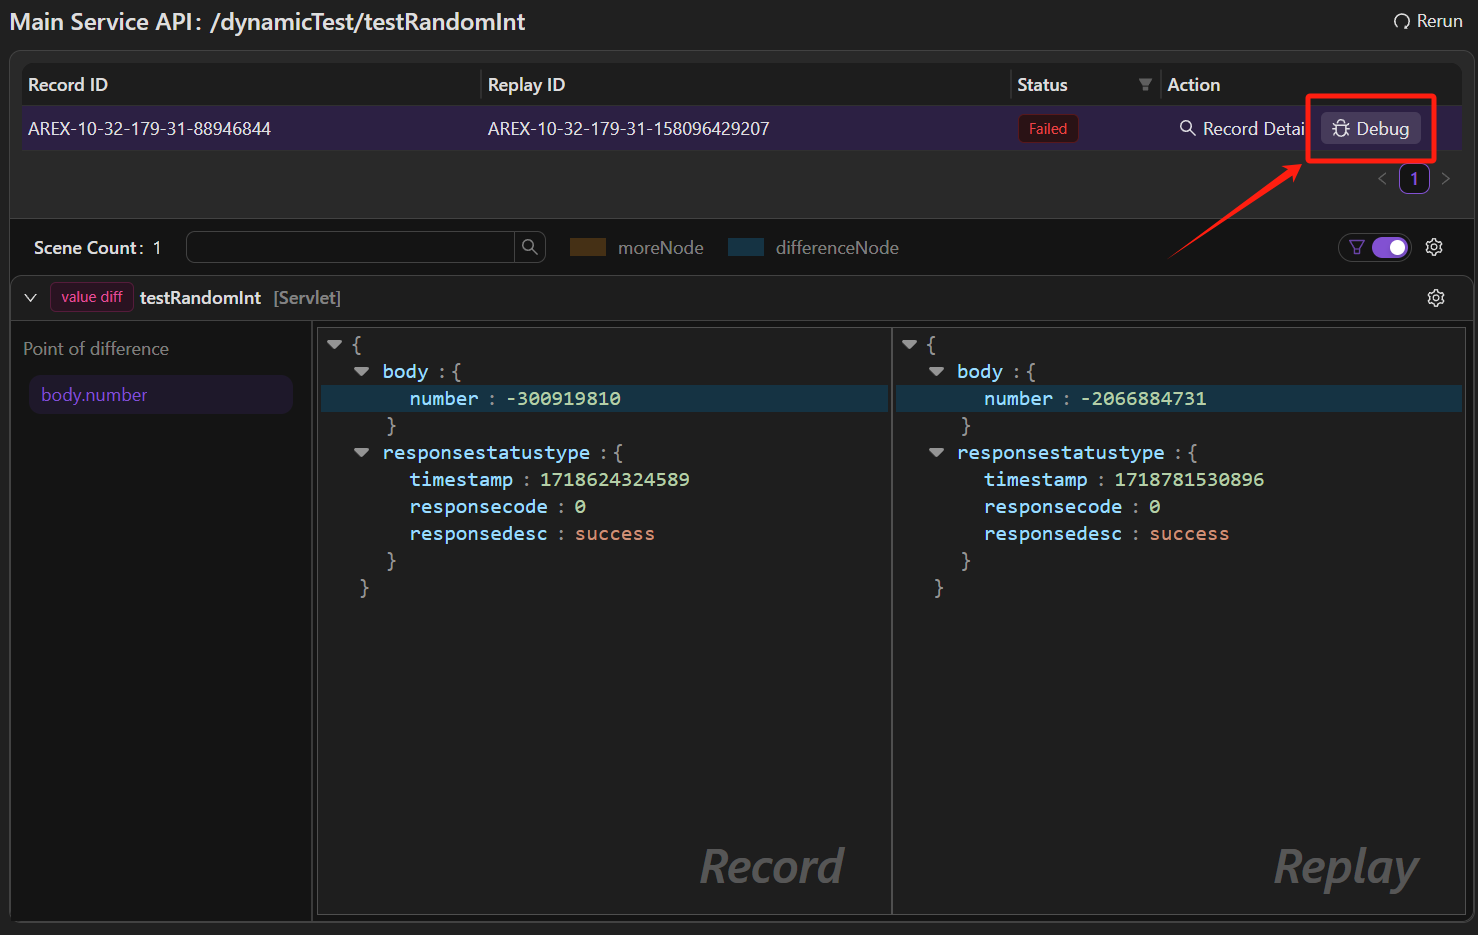
Click on the specific case, and the details of the differences will be displayed below the Failed cases (i.e., cases where discrepancies occur between the replay and the recorded response messages).
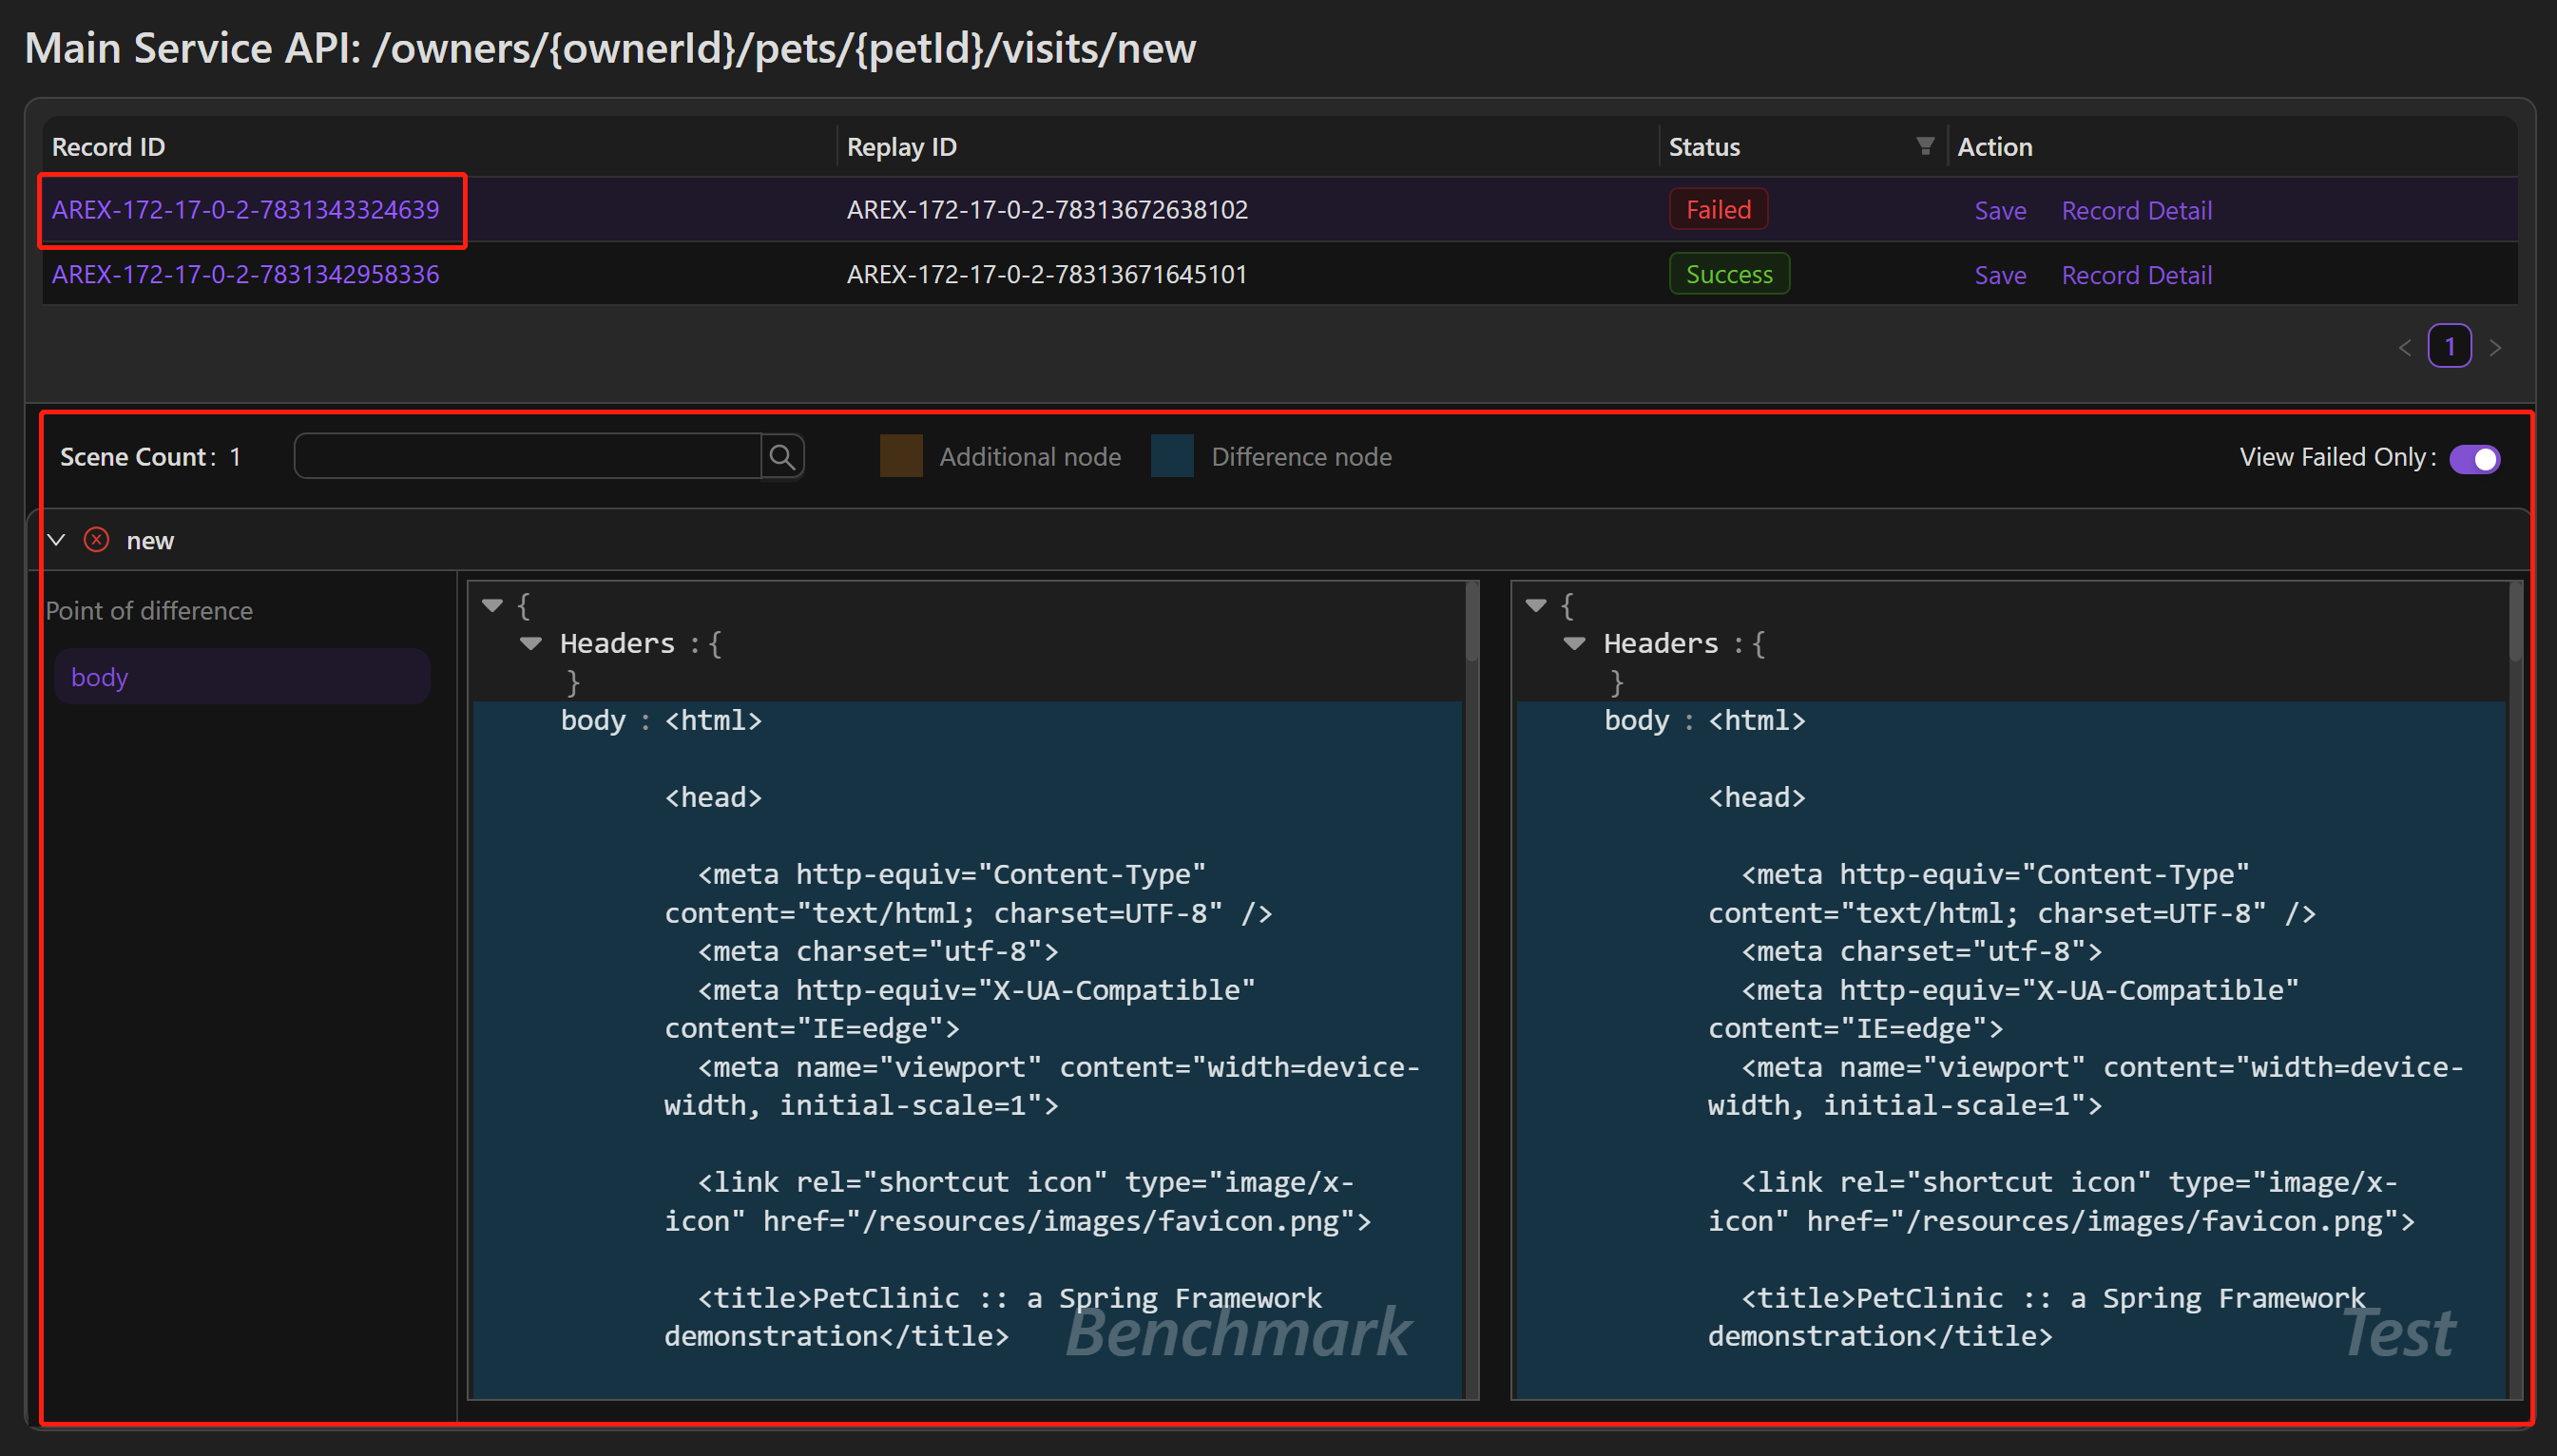
Point of Difference: Displays all the discrepancy points found during the replay test. For the main interface verification, the focus is on the differences between the recorded and replayed response messages. For verification of external calls to third-party dependencies, the comparison is made by examining the request content (such as the SQL statements for databases).
Scene Count: The number of scenarios where this discrepancy point occurs.
Additional Node: Nodes that are present in either the recorded or replayed response message but not in the other. If present, these discrepancy points are highlighted in orange within the message.
Difference Node: Nodes that differ between the recorded and replayed response messages. If present, these discrepancy points are highlighted in blue within the message.
Click on Record Detail, and the new page that opens will display the detailed information of that recorded case:
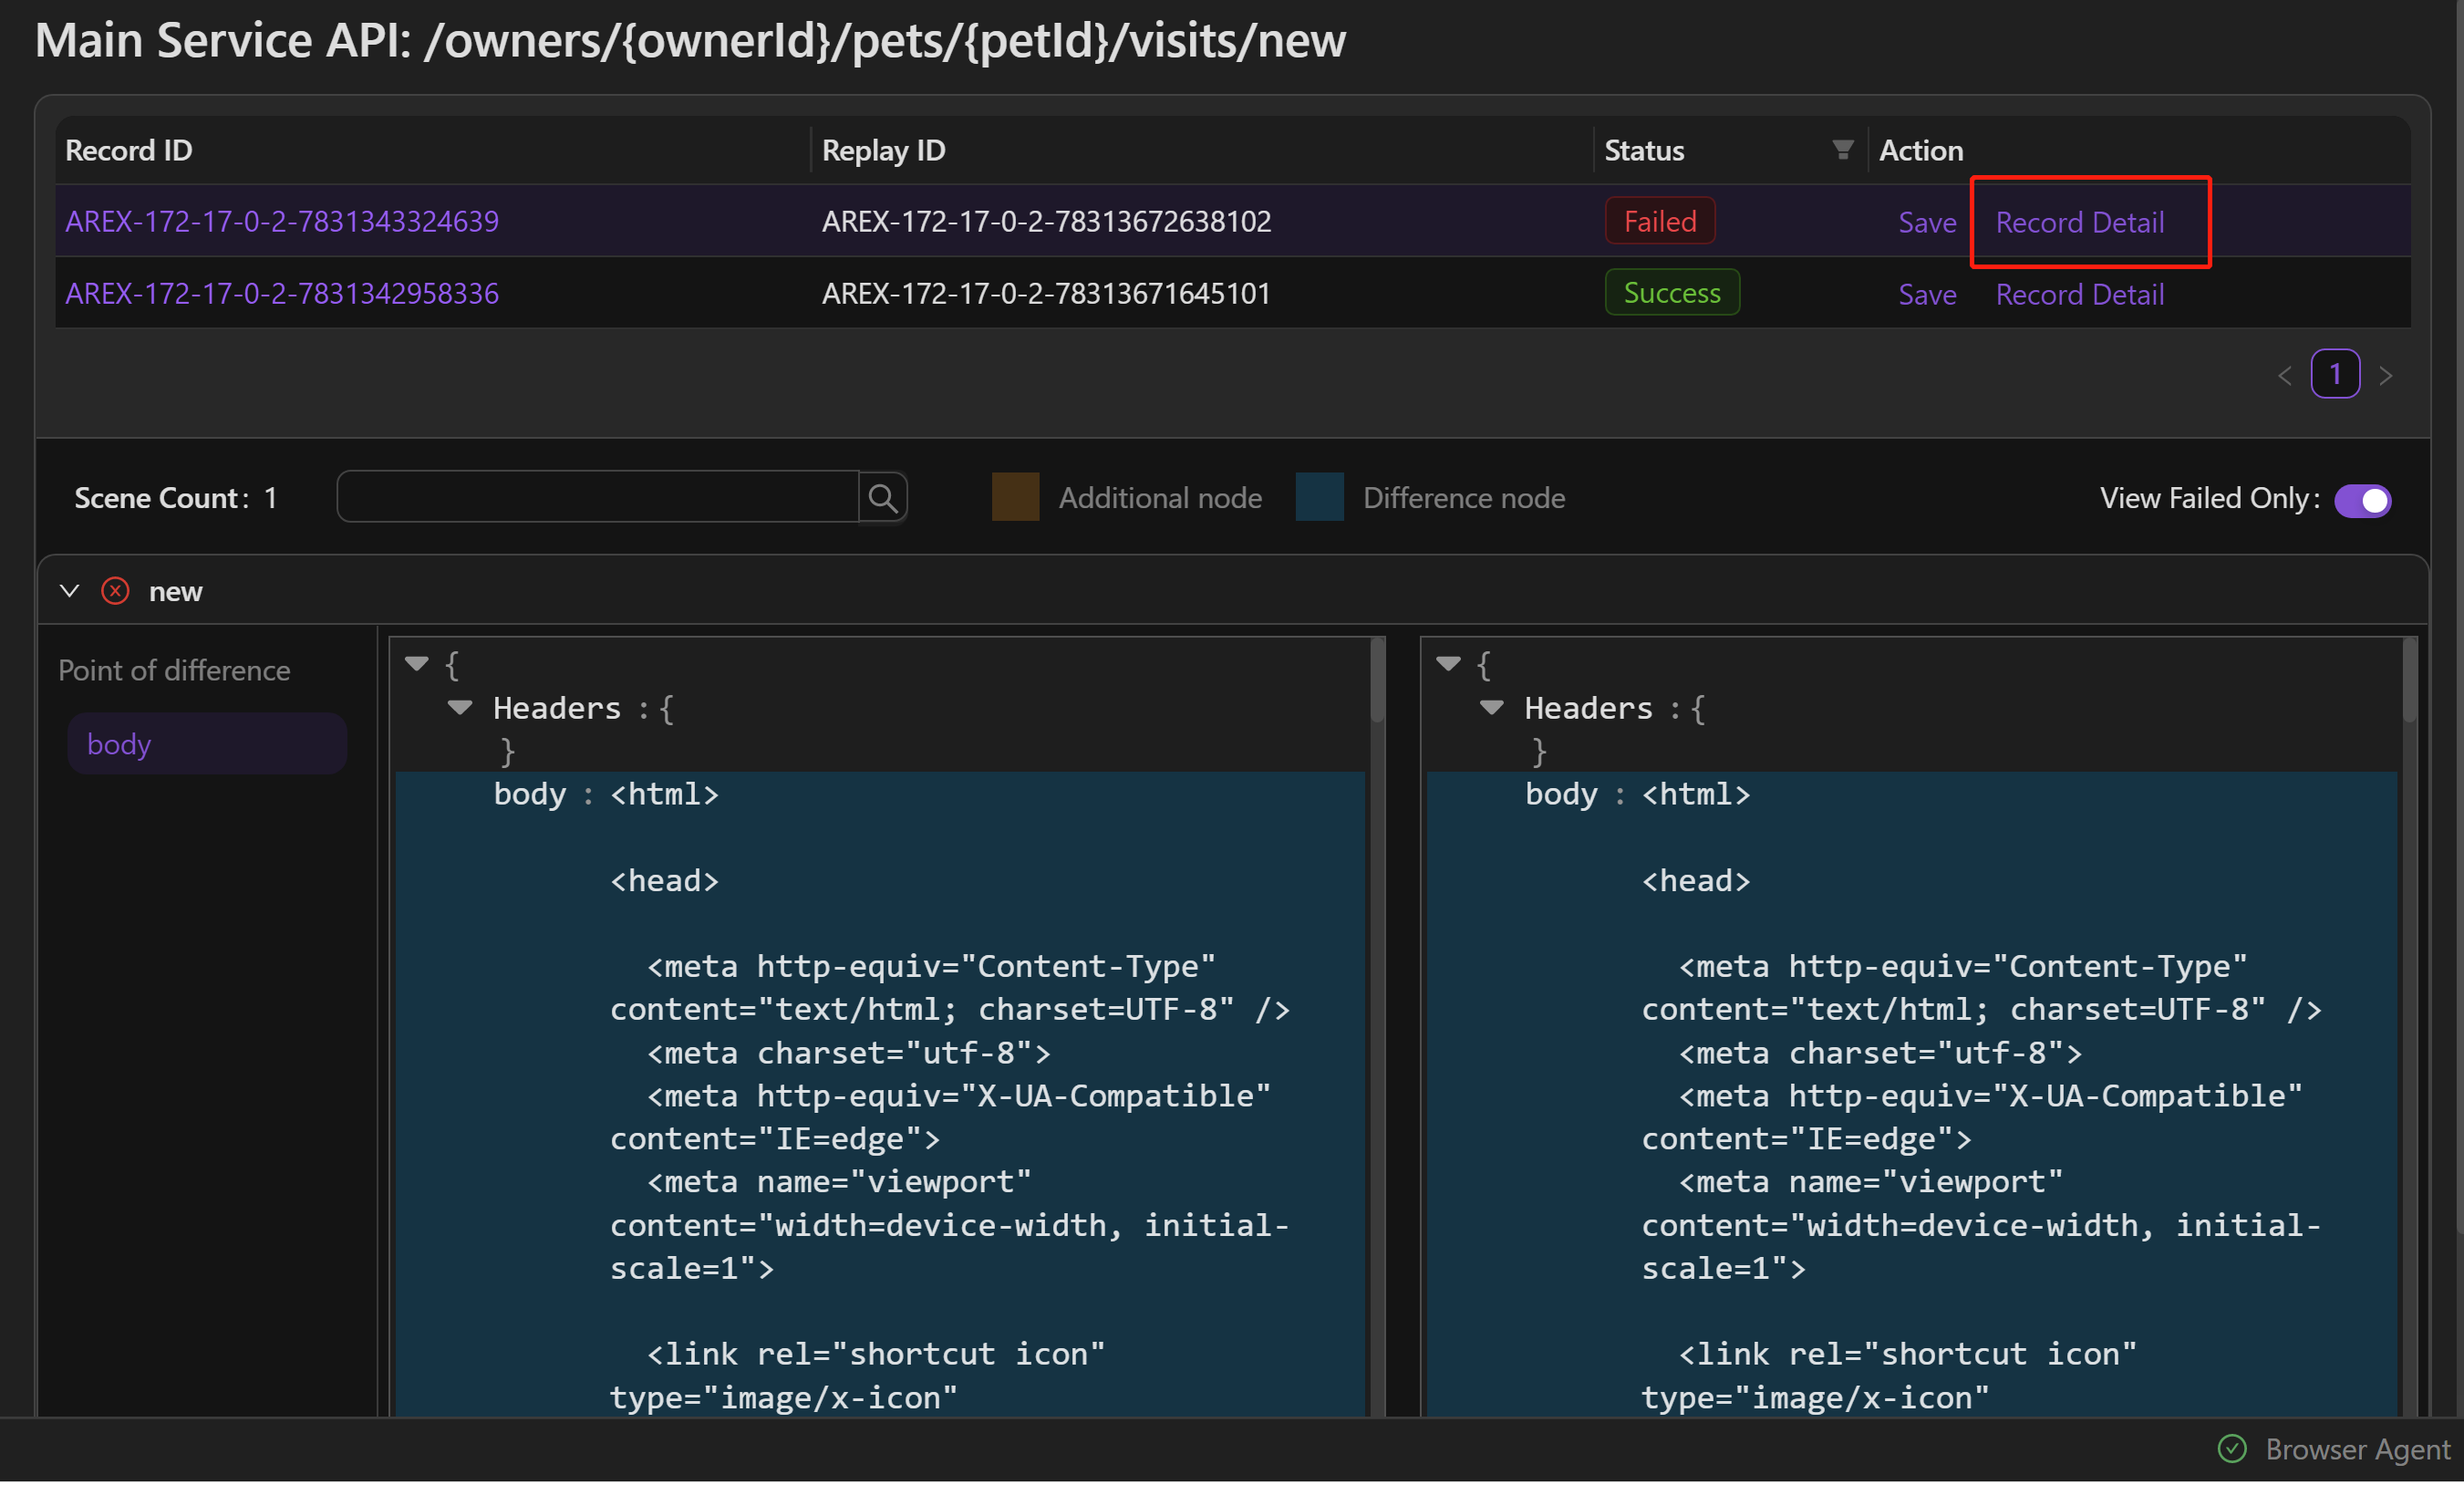
Click on Debug to enter the debugging page, and then click Save to save the case.
View test cases
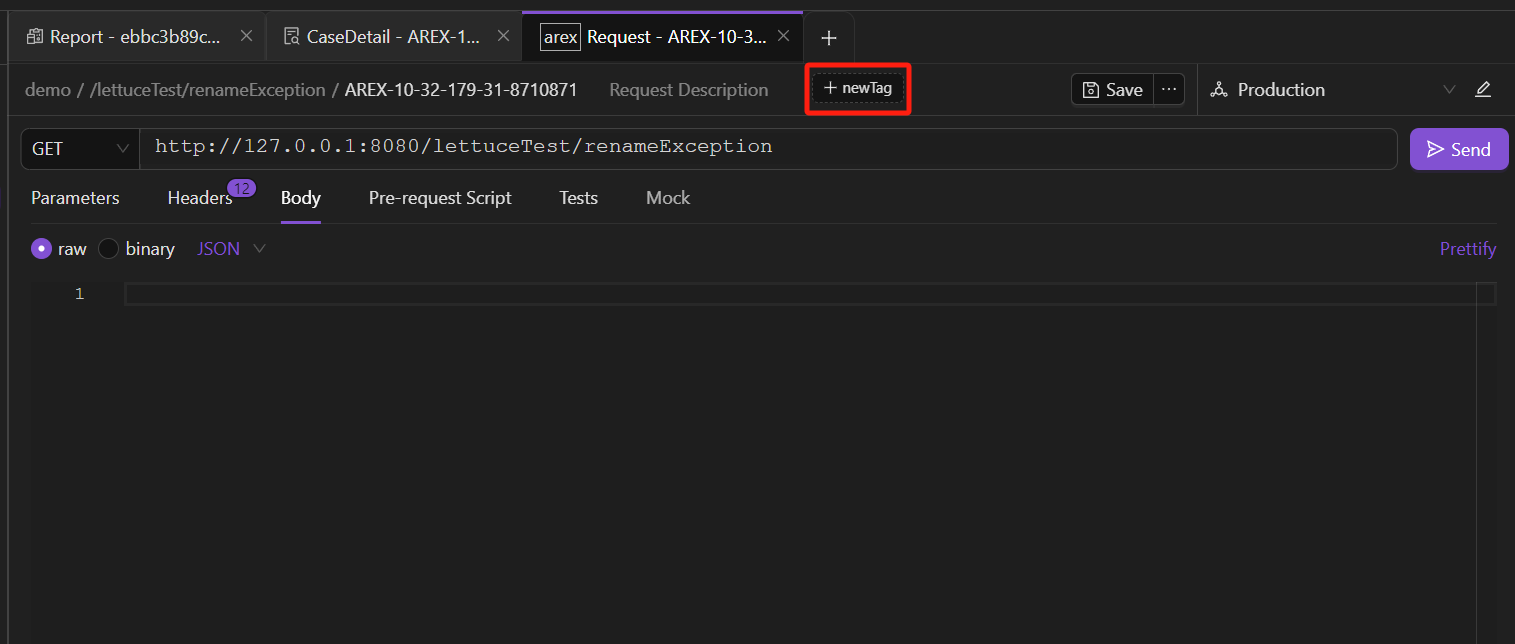
Once the test case is saved, you can view it under the corresponding collection request with a similar pattern as a request.
You can lick on newTag to add tags to this case for categorization.
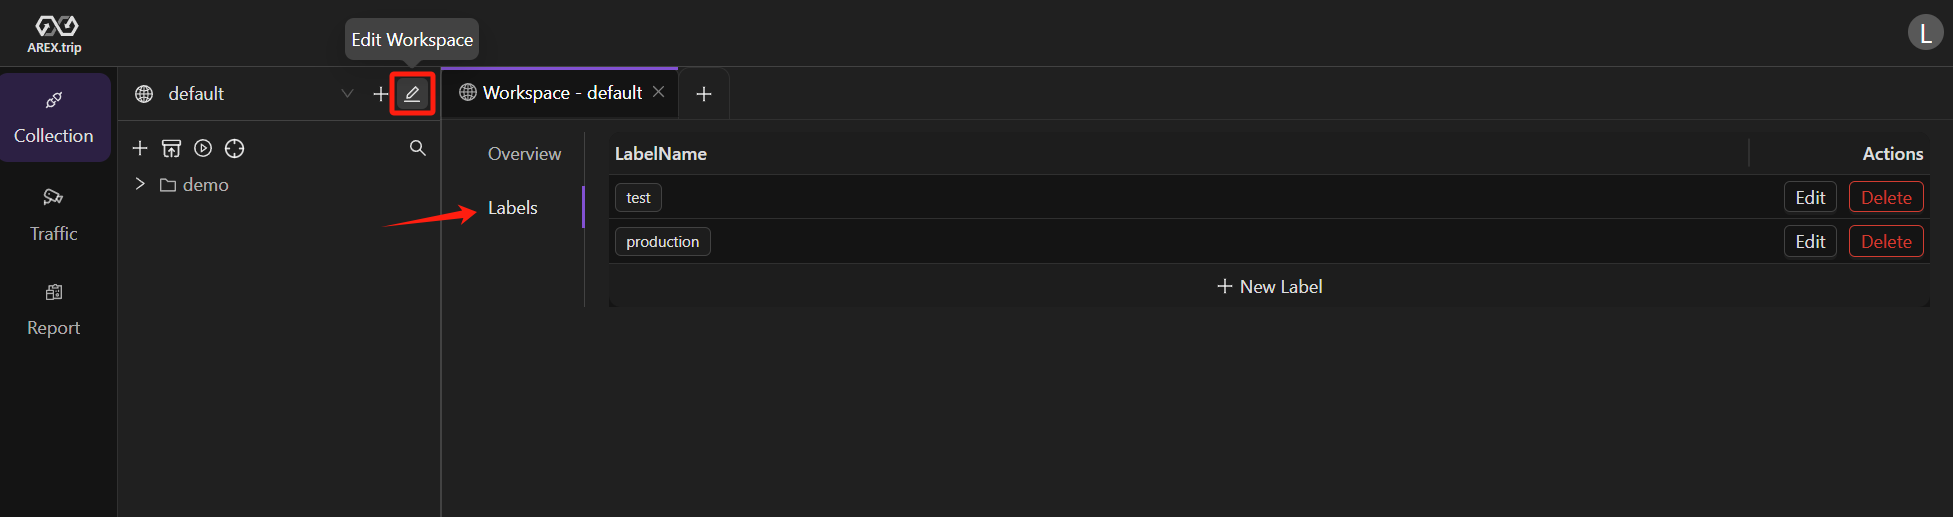
Tags can be pre-configured by selecting the Edit Workspace icon >> Labels tab.
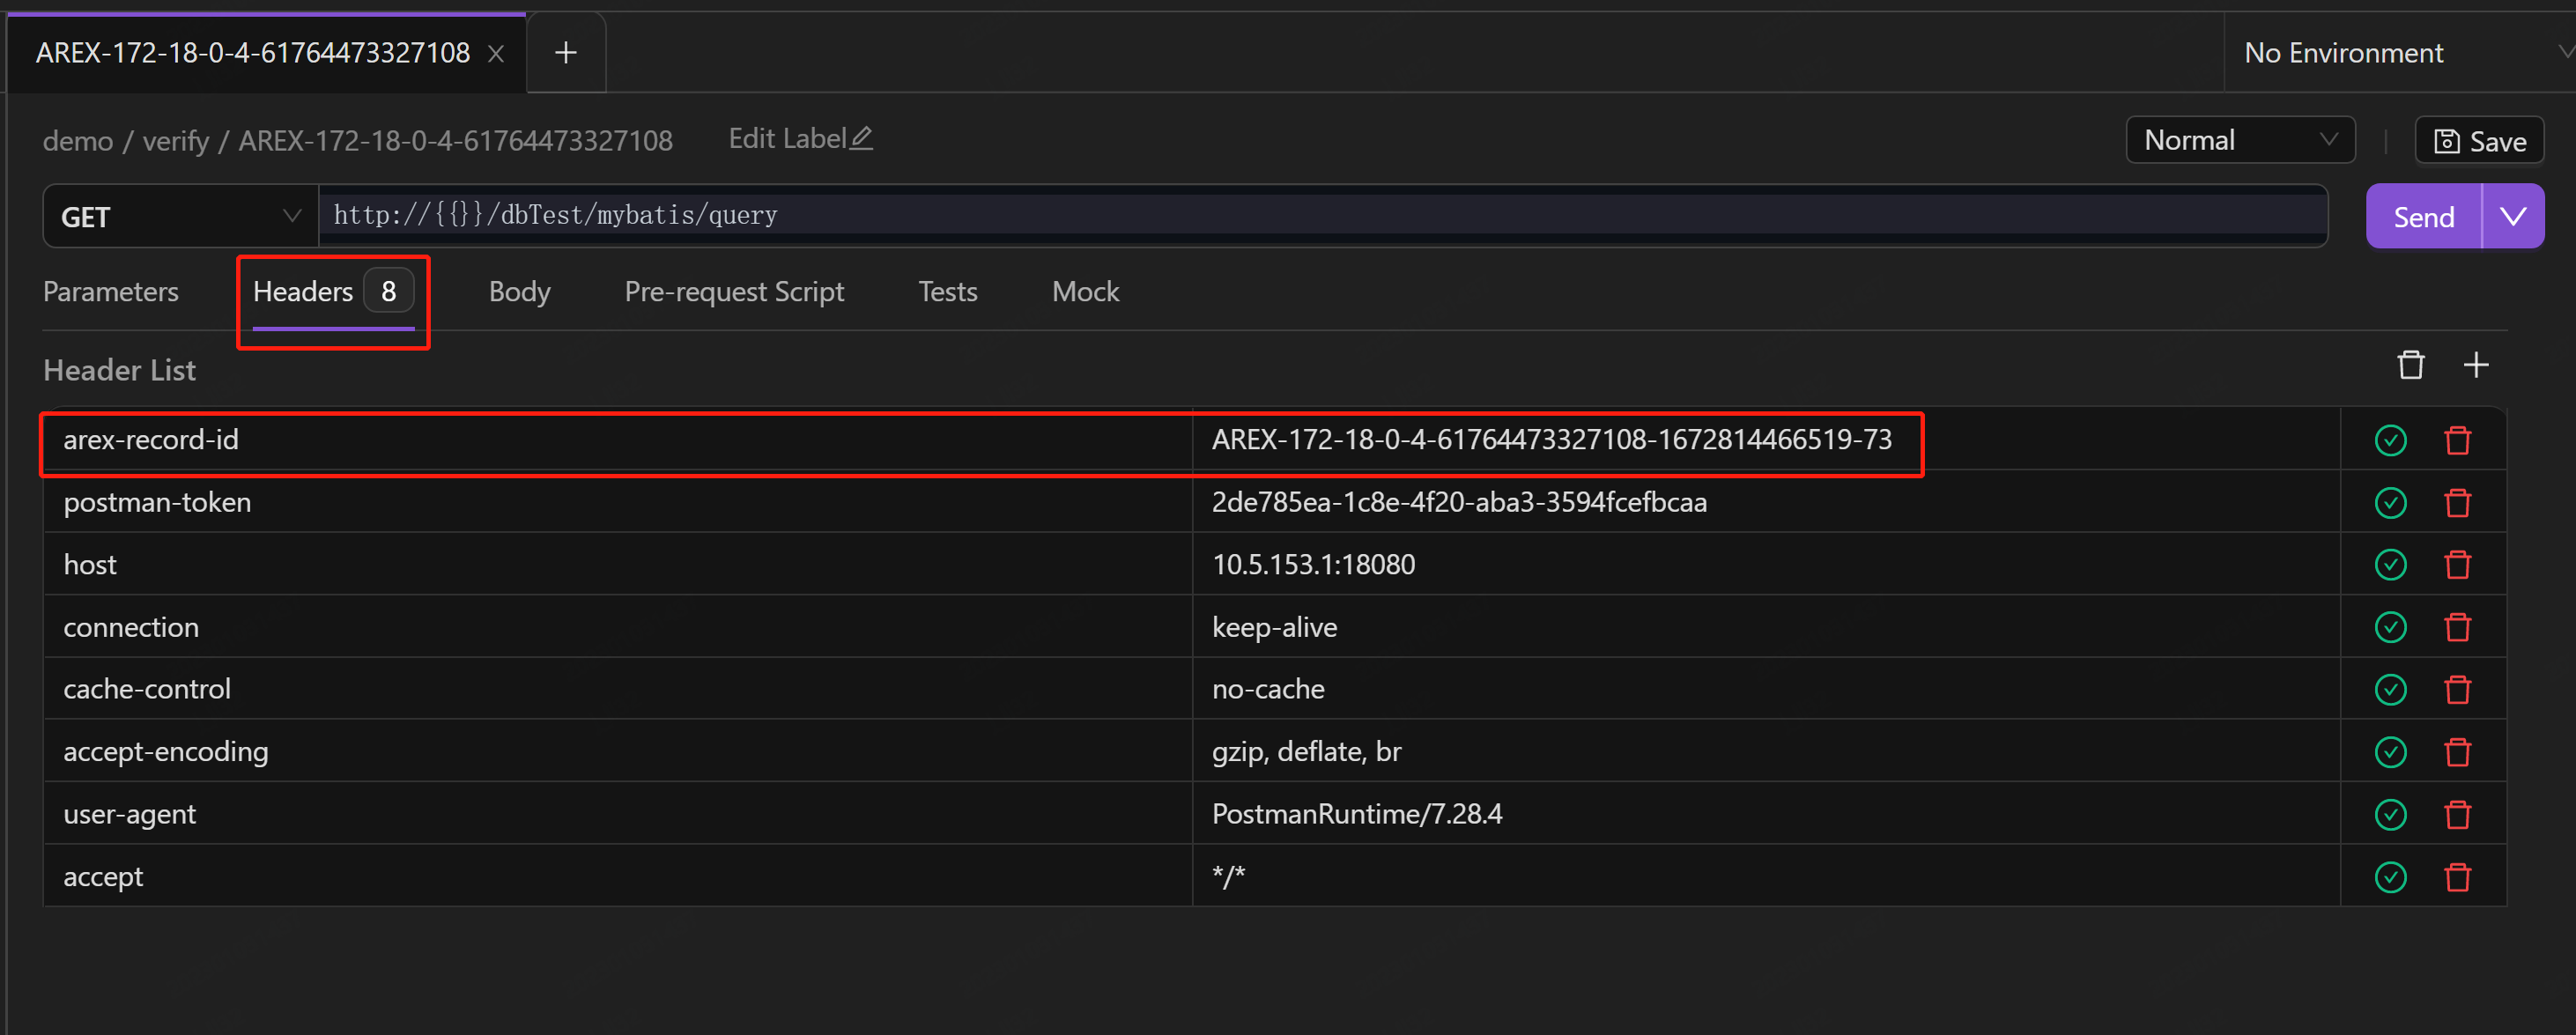
The request URL is point to the recording environment (production env).
The arex-record-id in the request Headers is the recording ID, if you want to replay the case in test environment, you can replace with the test environment's URL and then send the request.
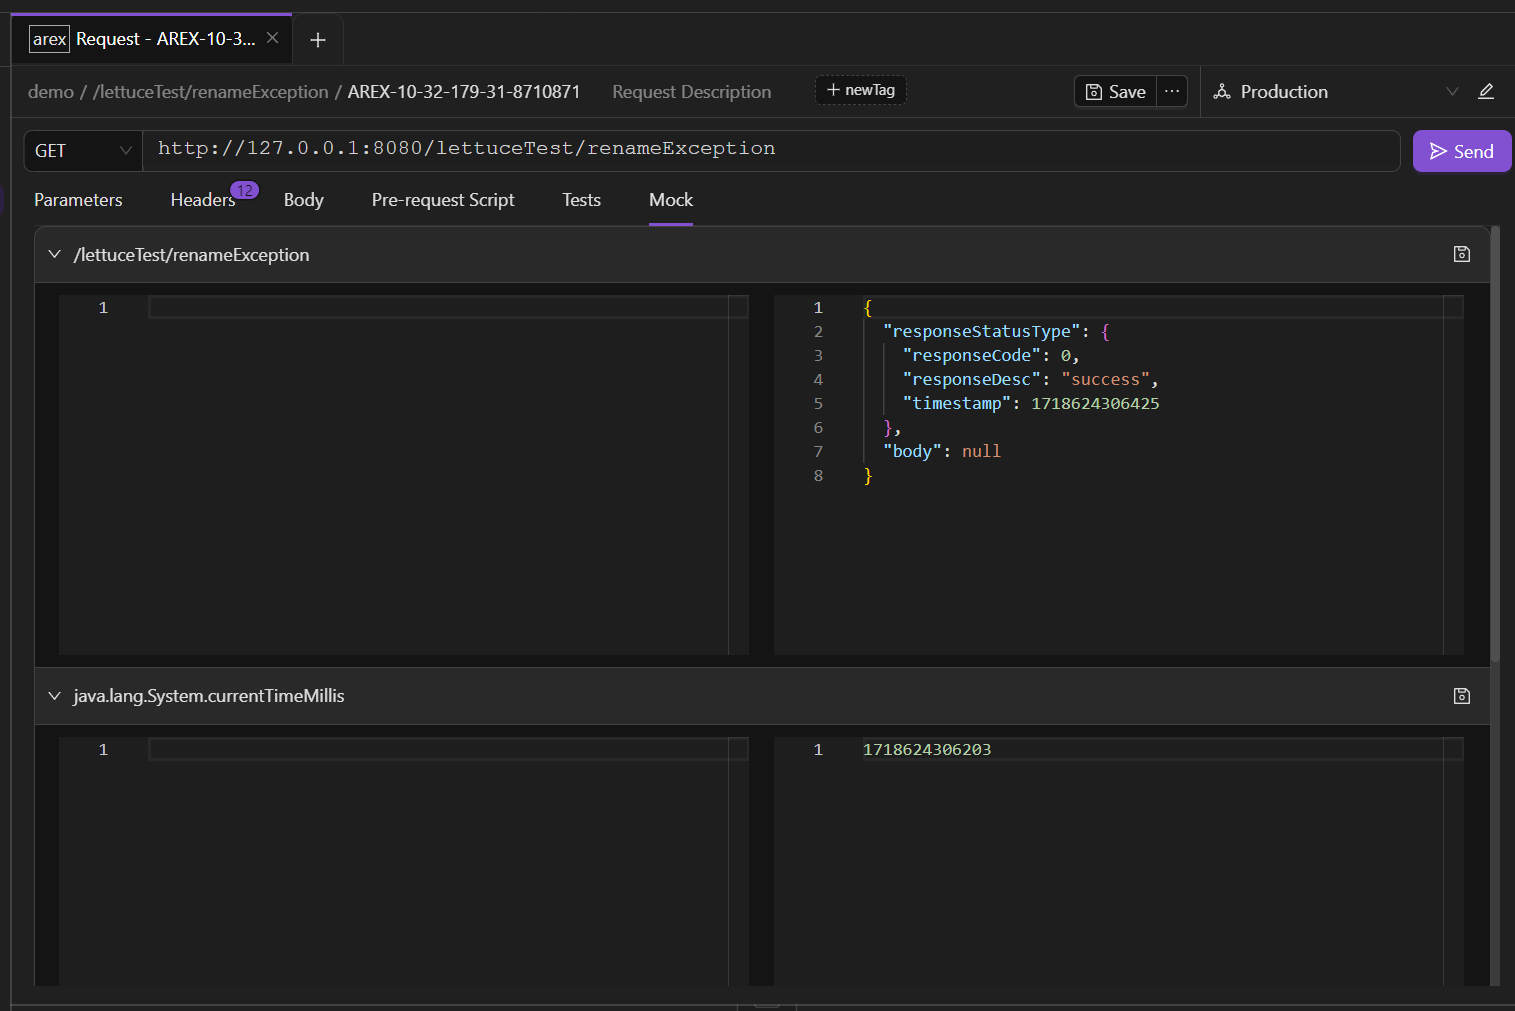
The Mock tab shows all data and third-party dependencies mocked from the production environment during recording.
The left side displays the mocked request messages sent to the main interface and external dependencies, while the right side displays the corresponding response messages.
The mock data can be edited, so if you are not satisfied with the mock data, you can manually modify it and click "Save". Then, you can test the API by using the mock data you want.
Replay saved cases
Replay saved cases is to perform regular regression validation on the saved cases.
AREX provides a Node.js script to implement regression testing for saved test cases of one app:
console.log('hello world')
const MongoClient = require('mongodb').MongoClient;
const mongoUrl = "mongodb://arex:iLoveArex@10.5.153.1:27017/arex_storage_db";
const scheduleEndpoint = 'http://10.5.153.1:8092/api/createPlan'
const appId = 'community-test-0905'
const targetHost = 'http://10.5.153.1:18080'

const client = new MongoClient(mongoUrl);


async function main() {
  await client.connect();
  const db = client.db();
  console.log('Connected successfully to server');

  // query auto pin cases
  const pinedCases = await db.collection('PinnedServletMocker').find({appId: appId}).project({_id: 1, operationName: 1}).toArray();
  const caseGroupByOp = new Map();
  pinedCases.forEach(item => {
    if (!caseGroupByOp.has(item.operationName)) caseGroupByOp.set(item.operationName, [])
    caseGroupByOp.get(item.operationName).push(item._id)
  })

  // query service operations
  const operations = await db.collection('ServiceOperation').find({appId: appId, operationName: {$in: [...new Set(pinedCases.map((item) => item.operationName))]}}).toArray()
  // console.log(operations);

  const createPlanReq = {
    "appId": "community-test-0905",
    "replayPlanType": 2,
    "targetEnv": targetHost,
    "operator": "AREX",
    "operationCaseInfoList": operations.map(op => ({
        "operationId": op._id.toString(),
        "replayIdList": caseGroupByOp.get(op.operationName)
    }))
  }

  const reqStr = JSON.stringify(createPlanReq, null, 4)
  console.log(reqStr)

  const response = await fetch(scheduleEndpoint, {
    method: "POST", // *GET, POST, PUT, DELETE, etc.
    headers: {
      "Content-Type": "application/json",
    },
    body: reqStr,
  });

  return response.status;
}

main()
  .then(console.log)
  .catch(console.error)
  .finally(() => client.close());
Once the script is executed, you can see the replay task on the reporting page: